
Ben Desjardins
Throwing money at marketing won’t fix your HVAC business. The real question is how much you need and where to put it so every dollar turns into booked installation revenue. Most contractors guess at budgets, then wonder why their cost per lead keeps climbing while close rates stay stuck.
The answer isn’t one size fits all. A startup chasing its first 10 installs per month needs a different mix than a regional chain defending market share across five states. But the math behind budget planning stays the same: start with target installs, work backward through your conversion funnel, and match your budget to what each channel actually delivers.
This guide walks you through budget tiers from $5k to $200k, showing exactly what to expect at each level. You’ll see channel by channel benchmarks, worked examples, and the tracking infrastructure you need to prove what’s booking jobs versus what’s burning cash.
TL;DR: Budget Ranges and Expected Outcomes
Here’s the executive view. Pick the tier that matches your capacity and growth goals, then dive into the details below.
Budget Tier | Monthly Spend | Expected Leads | Booked Installs | CAC Range | Monthly Revenue |
|---|---|---|---|---|---|
Starter | $5k–$10k | 30–60 | 3–8 | $625–$3,333 | $24k–$64k |
Growth | $15k–$30k | 90–180 | 12–25 | $600–$2,500 | $96k–$200k |
Scale | $50k–$100k | 300–600 | 40–80 | $625–$2,500 | $320k–$640k |
Dominance | $150k–$200k | 900–1,200 | 120–180 | $833–$1,667 | $960k–$1.44M |
Assumes $8k average install value, 13% lead to install close rate, and blended CPL of $16.36–$50 depending on channel mix.
At the Starter tier, you’re stabilizing lead flow and protecting your brand. Growth budgets let you capture in-market demand across all major channels. Scale budgets add always-on prospecting and content. Dominance budgets layer in brand building through CTV and multi-market SEO.
The right tier aligns with installer capacity and call handling bandwidth. If you can’t answer the phone within 90 seconds or your installers are booked three weeks out, more budget just wastes money.
Assumptions and Inputs Behind the Numbers
Before we unpack budgets, here’s the math we’re using so you can adjust for your market:
Average install value: $8,000. Your market might run higher for premium zones or multi-system homes.
Lead to install close rate: 10–15%, with stronger CSRs hitting 20%+. Financing offers improve this by 3–5 points.
Cost per lead (blended): $16.36 for Google Local Services Ads, $25–$50 for PPC, $10–$20 for organic SEO once ramped, $6–$12 for direct mail per household reached.
Call to appointment conversion: 40–60%, highly dependent on CSR training and speed to answer.
Appointment to close: 25–35%, influenced by financing approval rates and installer presentation skills.
Seasonality swing: Peak summer and winter months see 40–80% higher lead volume and 20–30% higher CPL. Shoulder months drop 30–50%.
Service mix: 60% residential installs, 25% repairs/tune-ups, 15% maintenance agreements. Install leads are highest value but lowest volume without demand creation.
These ranges come from published case studies and industry benchmarks. Your actual numbers will vary by competitive density, financing programs, and technician availability.
How Much Should You Spend? Two Ways to Set Your HVAC Marketing Budget
You’ve got two pathways to land on a budget that works. The percentage of revenue method is fast and scales with your business. The goal backed model starts from target installs and builds the budget you need to hit that number. Most operators benefit from running both and comparing the answers.
Percentage of Revenue Method (5%–12%)
Industry standard sits at 5–12% of gross revenue, but where you land depends on growth stage and market saturation. Mature businesses in less competitive markets can sustain growth at 5–7%. Newer operators or those in oversaturated metros need 10–12% to break through.
This method is simple and auto scales as revenue grows. The downside? It’s backward looking. If you had a slow quarter, your budget shrinks just when you need to invest more to recover. It also ignores installer capacity, so you might budget for 100 leads per month when your team can only handle 60.
Use this approach if you have predictable revenue and want a disciplined anchor. Pair it with seasonal adjustments so you’re not starving your budget during shoulder months when efficiency peaks.
Goal-Backed Model (From Target Installs)
This method reverses the equation. Start with how many installs you need to hit your revenue target, then calculate the leads and budget required to get there.
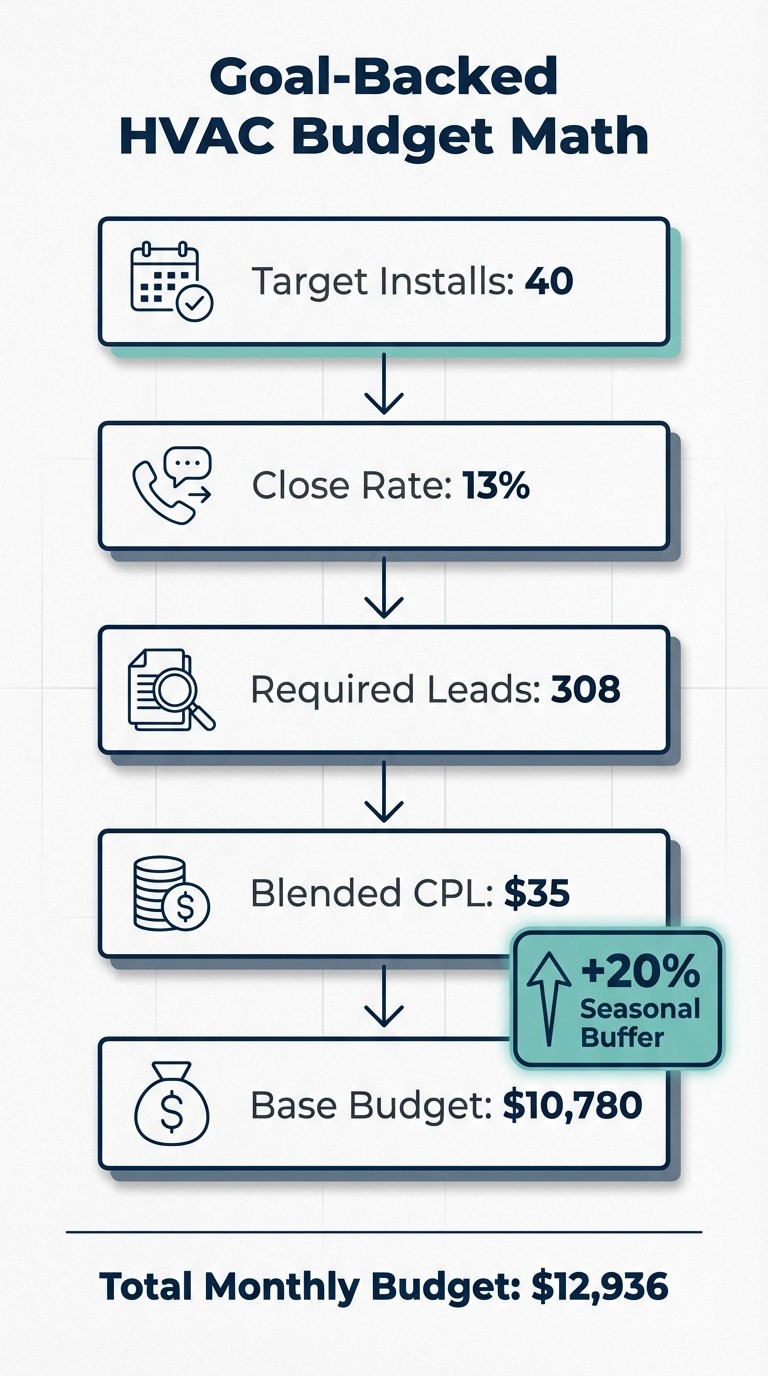
Step 1: Set your monthly install target based on capacity (for example, 40 installs).
Step 2: Divide by your close rate. At 13%, 40 installs require 308 leads.
Step 3: Multiply leads by blended CPL. If your mix yields a $35 CPL, you need $10,780 per month.
Step 4: Add 15–20% buffer for testing, ramp time, and seasonal swings. Budget becomes $12,400–$13,000.
This method aligns budget to operational reality. It forces you to know your close rate and CPL by channel, which means better tracking and faster optimization. The risk is underfunding if your conversion assumptions are too optimistic or your CPL climbs mid-season.
Worked Example: From 40 Installs/Month Target to Budget
Let’s say you’re targeting 40 installs per month to hit $320k in monthly revenue. Here’s the backward math:
Target installs: 40
Close rate: 13%
Required leads: 40 ÷ 0.13 = 308 leads
Blended CPL estimate: $35 (mix of LSA at $16, PPC at $45, SEO at $12, direct mail at $8)
Base budget: 308 × $35 = $10,780
Seasonal buffer (20%): $2,156
Total monthly budget: $12,936
In July or January, heat waves and cold snaps drive CPL up 25%, so you’d plan for $13,500–$14,000 those months. In April and October, you might pull back to $10,000 and reallocate to brand building channels like SEO content or CTV awareness campaigns.
This example assumes you’ve got CSRs who convert calls at 50%+ and installers who close appointments at 30%+. If those numbers are weaker, your required lead count climbs and your budget scales with it. Ready to see if your conversion funnel can support this volume? Let’s talk tracking infrastructure.
Budget Tiers and Channel Allocations ($5k–$200k)
Every tier balances capture (grabbing people already searching) against demand creation (putting your brand in front of folks who aren’t shopping yet). Lower tiers skew heavily toward capture because the ROI is immediate. Higher tiers add prospecting and brand because you’ve maxed out in-market volume.
Decision Guide: Choose your tier based on installer capacity first, then growth ambition. If you’re booked solid for two weeks, pause budget increases until you hire. If you’ve got bench capacity and a financing program, move up a tier and feed the funnel.
$5k–$10k Starter Tier (Lead Stabilization)
This budget protects your brand and captures high-intent searches without waste. You’re not building awareness or prospecting yet.
Channel Mix:
Google Local Services Ads: $2,500–$4,000 (pay per lead, high trust signal, dispute bad fits)
Branded PPC: $1,000–$1,500 (protect company name searches, call only ads)
GMB optimization + citation cleanup: $500–$1,000 (one time setup, then $100/mo maintenance)
Basic landing page A/B testing: $500–$1,000 (improve form and call conversions)
Expected Outcomes:
30–60 leads per month
$16–$35 CPL depending on market saturation
CAC of $625–$3,333 (assumes 10–15% close rate)
3–8 booked installs, $24k–$64k monthly revenue
SEO at this tier is groundwork only. You’re fixing NAP inconsistencies, claiming unclaimed citations, and maybe publishing one blog post per month. Don’t expect organic volume for six months.
This tier works for single-truck operators, new market entries, or businesses coming off a bad agency relationship who need to prove marketing works before committing more.
$15k–$30k Growth Tier (In-Market Capture + LSA)
You’ve proven the model and now you’re feeding it consistently. This tier adds non-brand PPC, retargeting, and structured SEO content.
Channel Mix:
Google LSA: $5,000–$8,000 (max out quality score, aggressively dispute junk leads)
PPC (non-brand + emergency): $5,000–$10,000 (service keywords, geo targeted, dayparting)
Retargeting (Meta/Display): $1,500–$3,000 (re-engage site visitors with financing offers)
SEO + content: $2,000–$5,000 (monthly blog, citation expansion, on-page optimization)
GMB posts + review generation: $500–$1,000
Expected Outcomes:
90–180 leads per month
Blended CPL of $25–$40
CAC of $600–$2,500
12–25 booked installs, $96k–$200k monthly revenue
At this tier, good means booking 15%+ of your leads within 48 hours of first contact. If you’re seeing 10% or below, your CSR scripts or response time need work before you scale budget further.
You’ll start seeing SEO traction here (5–10 organic install leads per month by month six). PPC will still handle most of the volume, but organic leads cost you $10–$15 once content is seeded, making them your highest-margin source.
$50k–$100k Scale Tier (Full Funnel + Local Brand)
This is where you own in-market demand and start creating it. You’re running always on search, maxing LSA, adding paid social prospecting, and publishing content that ranks for install keywords.
Channel Mix:
Google LSA: $10,000–$15,000 (max budget, multi-service categories, fast dispute process)
PPC (search + call only): $15,000–$25,000 (emergency, install, brand, competitor terms)
Paid social (Meta/TikTok install funnels): $8,000–$15,000 (video creative, financing hooks, retargeting)
SEO + pillar content: $8,000–$15,000 (weekly content, link building, technical SEO audits)
Direct mail (targeted): $5,000–$10,000 (15+ year old systems, high income ZIPs)
Aggregators (selective): $2,000–$5,000 (cherry pick premium ZIP codes, avoid duplicates)
Expected Outcomes:
300–600 leads per month
Blended CPL of $20–$35
CAC of $625–$2,500
40–80 booked installs, $320k–$640k monthly revenue
CPL by channel at this tier: LSA $16–$18, PPC $30–$50, organic SEO $10–$15, paid social $40–$60, direct mail $8–$12. You’re blending low cost organic and mail with higher cost PPC and social to smooth out CPL.
You’ll hit diminishing returns on LSA around $12k–$15k per month in most markets. Beyond that, you’re buying lower-intent inquiries or competing in adjacent service areas. That’s your signal to shift incremental dollars into brand channels like social and content.
$150k–$200k Market Dominance Tier (Always On + CTV)
You’re no longer just capturing demand, you’re shaping it. This budget layers OTT/CTV, direct mail bursts, and multi-location SEO on top of maxed capture channels. The goal is owning share of voice so competitors can’t break through.
Channel Mix:
Google LSA: $15,000–$20,000 (maxed in primary service area, overflow to adjacent markets)
PPC: $30,000–$50,000 (search, display, YouTube pre-roll, competitor conquesting)
Paid social: $20,000–$30,000 (always on prospecting, seasonal creative rotations)
SEO + multi-location content: $20,000–$30,000 (state level authority, location pages, link campaigns)
OTT/CTV: $15,000–$25,000 (geo fenced DMAs, branded search lift tracking)
Direct mail + inserts: $10,000–$20,000 (seasonal bursts, targeted by system age and home value)
Radio/podcast (select DMAs): $5,000–$10,000 (brand reinforcement, promo code tracking)
Expected Outcomes:
900–1,200 leads per month
Blended CPL of $18–$30 (brand lift lowers CPL on search over time)
CAC of $833–$1,667
120–180 booked installs, $960k–$1.44M monthly revenue
Branding lift from CTV and radio takes 8–12 weeks to compound. You’ll see branded search volume climb 30–50%, which lowers your PPC costs and improves LSA quality scores. The ROI isn’t immediate but it stacks month over month.
This tier demands multi-location CRM hygiene, call tracking with number pools for every channel, and monthly attribution reviews. If you’re not importing offline conversions into Google Ads and tying CTV impressions to branded search spikes, you can’t tell what’s working.

Channel Benchmarks for HVAC in 2026
Here’s what to expect from each channel in terms of cost, conversion, and ramp time. Use these ranges to set your internal KPIs and spot underperformance early.
Google Search/PPC
CPL Range: $30–$60 depending on match type and keyword intent. Emergency and install terms run higher. Branded terms under $15.
CVR to Lead: 8–15% on search ads, higher for call only formats.
Call to Book Rate: 40–60% with trained CSRs and sub 90 second answer times.
CAC: $600–$2,500 for installs (depends on close rate and average job value).
Ramp Time: 2–4 weeks to gather enough data for bid optimization.
Seasonality Sensitivity: High. CPCs jump 20–30% during heat waves and cold snaps.
Common pitfalls: broad match without negative lists burns budget on repair inquiries when you’re targeting installs. After hours calls go to voicemail and tank conversion rates (enable call only ads with business hours restrictions or use an answering service).
Quality Score drives cost. RSAs with tight ad to keyword relevance and fast landing pages can cut CPC by 30–40%. If your Quality Score sits below 7, audit your landing pages and ad copy before increasing spend.
Google Local Services Ads (LSA)
Cost per Lead: $16.36 industry average, varies by metro and service category.
Dispute Rate: 10–20% of leads are disputable (wrong service area, spam, unqualified). Aggressive dispute management cuts effective CPL by $2–$4.
CVR to Booked Job: 12–18% (LSA leads convert better than PPC because of the Google Guarantee badge).
Profile Optimization Levers: Review velocity, response time, and complete profile details. Profiles with 50+ reviews and 90%+ response rates get 2–3x more volume at lower cost.
LSA is pay per lead, so budget is semi-controllable. Set weekly caps and monitor lead quality daily. If you’re seeing junk leads, tighten service area radius or pause low performing categories like “duct cleaning” that attract price shoppers.
Review generation directly impacts LSA volume. Companies adding 10+ reviews per month saw lead volume increase 40–60% within 90 days without raising weekly budget.
SEO + Content + Local Citations
Ramp Time: 4–6 months before consistent organic install leads. 8–12 months to see compounding effects.
Content Cadence: 4–8 blog posts per month focused on install keywords, financing, and local service area pages.
Cost per Organic Lead (Once Seeded): $10–$15 when factoring in monthly content and link building costs.
Compounding Effect: Organic traffic doubles every 6–9 months with consistent publishing and link acquisition. One case study showed 7x traffic increase over 18 months.
SEO is the highest margin channel long term, but it demands patience. In the first 90 days, you’re fixing technical issues, claiming citations, and publishing foundational content. Leads trickle in month 4–6, then accelerate.
Citation consistency (NAP across 40–60 directories) is table stakes. Inconsistent listings confuse Google and suppress Local Pack rankings. Budget $500–$1,000 upfront for citation cleanup, then $100–$200 monthly for monitoring.
Link building for local HVAC is about quality over quantity. Ten links from local news sites, chambers of commerce, or industry associations outperform 100 directory spam links. Expect to spend $200–$500 per earned link.
Paid Social (Meta/TikTok) for Installs
CPL Range: $40–$70, higher than search because intent is lower.
Creative Angles That Work: Before/after install videos, financing callouts (“$79/month, no credit check”), seasonal urgency (“beat the heat wave”), and installer personality/trust signals.
CVR to Lead: 3–6% (cold traffic). Retargeting converts at 10–15%.
Close Rate: 8–12% (lower than search leads due to less intent).
Paid social works best when layered on top of search capture. Use it to build awareness in your service area and retarget website visitors who didn’t convert. Standalone social campaigns without search support waste budget on low intent clicks.
Financing offers are the unlock for social. Leads who see “$89/month, 0% APR for 60 months” convert 2–3x better than those who see “$8,500 new AC install.” If you don’t offer financing, skip paid social for installs and focus that budget on search.
Tight lead handling is critical. Social leads go cold in 4–6 hours. If your CSRs don’t respond same day, your cost per booked job climbs 40–60%.
Direct Mail + Mailers
Cost per Household: $0.80–$1.50 for postcards, $2–$4 for letters.
Response Rate: 0.5–2% for cold lists, 3–5% for targeted lists (15+ year old systems, high income ZIPs).
Tracking: Use unique phone numbers or promo codes. One case study tracked 10 responses per 5,000 piece mailing using dedicated tracking numbers.
Direct mail shines when targeting system replacement cycles. Homes with 15–20 year old systems are statistically due for replacement. Overlay income data to prioritize high value installs over budget shoppers.
Seasonal timing matters. Mail 4–6 weeks before peak season (April for summer cooling, September for winter heating) so your brand is top of mind when systems fail.
ROI variance is wide: 127% to 2,655% in published case studies. The difference is targeting precision. Spray and pray mailings to every household waste money. Targeted lists based on system age and home value deliver 5–10x better ROI.
Aggregators/Marketplaces
Cost per Lead: $25–$75 depending on exclusivity and service type.
Quality Variability: High. Aggregators sell the same lead to 3–5 contractors, so speed to contact determines who wins.
Duplication Risk: 30–50% of aggregator leads also come through your PPC or LSA campaigns. Track by phone number or email to avoid double paying.
Cherry picking tactics: Buy leads only in your top performing ZIPs. Pause categories with low close rates (repairs, tune-ups) and focus on installs. Negotiate exclusive leads if your close rate proves you can monetize them.
Dependency risk is real. Aggregators can raise prices 20–30% mid-season or cut your territory without warning. Use them to fill gaps, not as your primary lead source. If aggregators represent more than 30% of your lead volume, you’re vulnerable.
OTT/CTV/Radio
CPM Range: $15–$35 for OTT/CTV, $8–$20 for streaming audio.
CPCV (Cost per Completed View): $0.05–$0.15 for 30 second spots.
Geo Targeting: DMA level only for most platforms. ZIP level targeting requires premium inventory or direct buys.
Success Metric: Branded search lift. Track Google Search Console impressions for your company name before, during, and after campaigns. Expect 30–50% lift during flight.
Media spend is a long game. Don’t expect direct-attribution installs in month one. The value is in brand recall, so when a prospect’s AC fails, they search your name instead of “AC repair near me.”
Creative frequency matters more than reach. Running 6–8 exposures per household over 4 weeks beats a single impression to 10x the audience. Budget accordingly (most DMAs need $10k–$15k per month minimum to hit effective frequency).
Tie media flights to search budget increases. When you run CTV in June, raise your branded PPC budget by 20–30% to capture the search lift. If you don’t, competitors will bid on your name and steal the traffic you just paid to generate.
Seasonality, Geo, and Capacity: How to Modulate Spend
Static budgets leave money on the table. The smartest operators adjust spend 30–60 days ahead of weather driven spikes and pull back during shoulder months to reinvest in long term channels.
Peak vs Shoulder Months: Bid and Message Shifts
Peak Months (June–August, December–February):
Increase PPC bids by 20–30% to maintain position as CPCs rise.
Shift messaging from “install” to “emergency repair” and “same day service.”
Pause broad match campaigns and focus on exact match high intent keywords.
Add call only ads with after hours coverage to capture late night emergencies.
Boost LSA weekly budget caps by 30–40%.
Shoulder Months (April–May, September–October):
Pull back PPC by 15–20% as CPCs drop and competition eases.
Shift messaging to “pre-season tune-up,” “financing offers,” and “book now, install later.”
Reallocate savings into SEO content, link building, and CTV brand campaigns.
Test new creative and landing pages while traffic is cheaper.
One thing to watch: overbooking during peak weeks creates CSR burnout and installer delays, which tank your close rate. If your team is slammed, cap LSA budget and let competitors waste money on leads you can’t fulfill.
Multi-Location and Coverage Radius Economics
Budget scales with service area size and local CPC. A single location operator in a mid size metro might spend $20k per month profitably. A five location regional chain needs $80k–$120k to cover all territories at similar lead density.
Avoid thin spend across too many ZIPs. Spreading $10k over 50 ZIP codes means $200 per ZIP, which isn’t enough to gather statistically significant data or maintain top of page visibility. Start with your top 10 ZIPs by revenue, then phase in adjacent areas as budget grows.
Multi-location SEO demands unique content per location. Duplicate service pages with swapped city names get filtered by Google. Budget $1,000–$2,000 per location for custom landing pages, local link building, and citation management.
Capacity, Financing, and Call Handling
Financing approval rates directly impact realized ROI. If 60% of your install leads need financing and only 40% get approved, you’re losing half your pipeline. Partner with multiple lenders to improve approval odds, or shift budget toward cash buyers (older homeowners, higher income ZIPs).
Installer capacity is your constraint. If you’re booking installs two weeks out, more leads just create longer wait times and higher cancellation rates. Hire or subcontract before scaling budget past your fulfillment capacity.
CSR speed and quality determine how much of your paid traffic converts. A lead that waits 4 hours for a callback is 50% less likely to book than one answered in 90 seconds. Run monthly call audits, track answer rates, and set SLAs: 90% of calls answered within 90 seconds, 100% of form fills contacted within 2 hours.
If lead leakage is killing your ROI, start with better tracking and follow-up systems before you add another dollar to media spend.
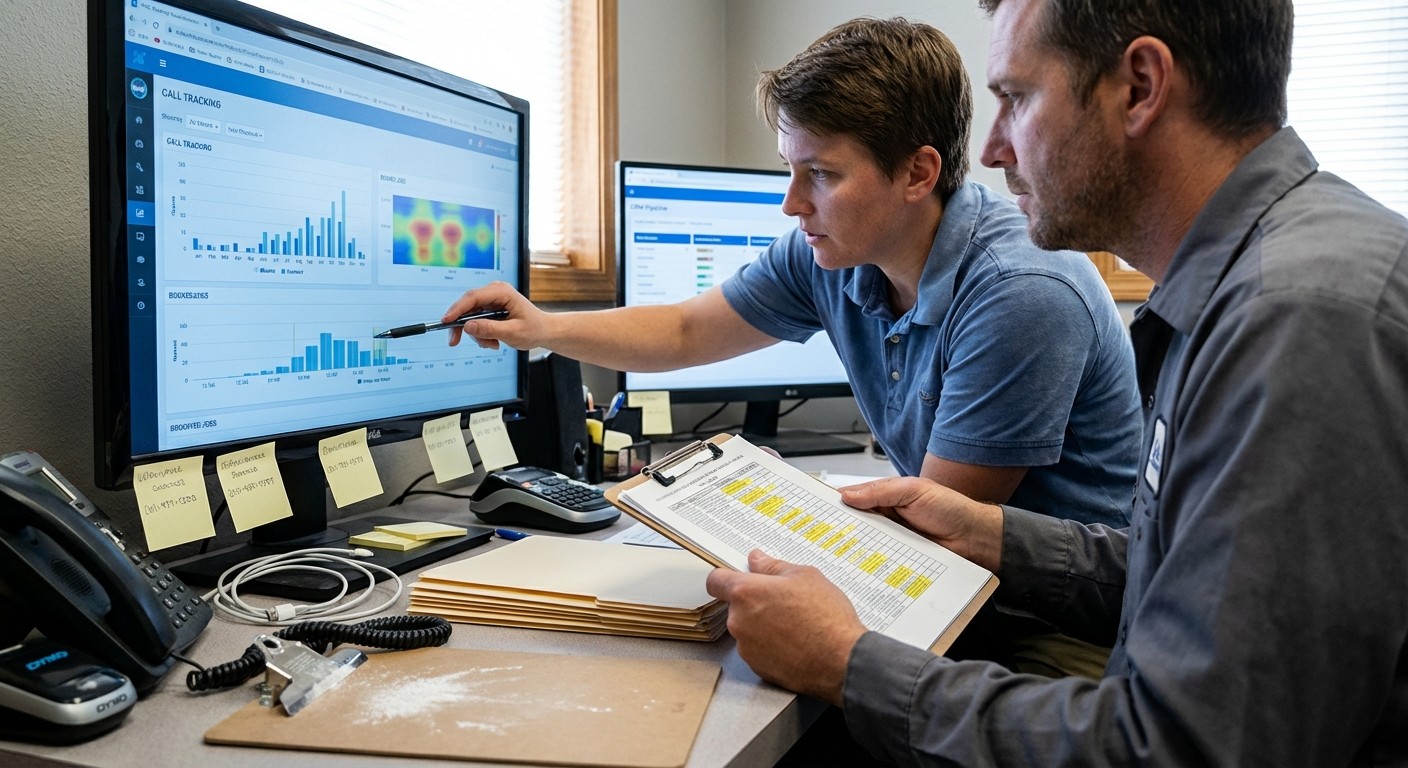
Tracking That Proves What Books Jobs
You can’t optimize what you don’t measure. The minimal viable tracking stack for HVAC marketing includes call tracking with dynamic number insertion, CRM with lead source tagging, and offline conversion imports into Google Ads.
KPI Ladder: Impression → Lead → Job → Revenue
Track each stage and benchmark against these targets:
Impression to Click: 3–8% CTR for search ads, 0.5–2% for display and social.
Click to Lead: 8–15% conversion rate on landing pages (form fill or call).
Lead to Appointment: 40–60% with strong CSR handling and sub 2 hour response times.
Appointment to Booked Job: 25–35%, higher with financing pre-qualification and multi-option quotes.
Booked Job to Revenue: Track no-shows and cancellations. Anything above 10% signals a problem in expectation setting or scheduling friction.
Where most operators break: the lead to appointment stage. If you’re converting clicks to leads at 12% but only 30% of leads book appointments, your CSR scripts or response speed need work before you scale budget.
Required Tooling: Call Tracking, CRM, OSA, and LSA Exports
Call Tracking: Use dynamic number insertion so every campaign, ad group, and keyword gets a unique trackable number. Number pooling with 20–50 numbers ensures accuracy even at high traffic volumes.
CRM Lead Source Tagging: Capture UTM parameters and GCLID in hidden form fields. Tag every lead with source, medium, campaign, and keyword so you can calculate CPL and CAC by channel.
Offline Conversion Imports: Export booked jobs from your CRM and import them into Google Ads weekly. This tells Google which clicks turned into revenue, enabling automated bidding strategies that optimize for installs, not just leads.
LSA Lead Exports: Download LSA leads weekly and cross reference with your CRM by phone number or email. Dispute duplicates and mark no-shows to improve your LSA quality score.
Without this stack, you’re flying blind. You’ll know you spent $30k and booked 50 installs, but you won’t know which $10k drove 40 of those jobs and which $20k wasted money on junk leads.
Attribution You Can Trust: PPC, LSA, SEO, and Direct Mail
PPC Attribution: Track GCLID in your CRM and import booked jobs as offline conversions. This closes the loop and shows Google which keywords and ads drive revenue.
LSA Attribution: LSA provides lead data directly in the app. Export weekly, match to CRM by phone, and tag with “booked” or “no-show.” Calculate true CPL after disputes.
SEO Attribution: Use UTM tagged links in content and track organic sessions in Google Analytics. Cross reference organic form fills and calls against CRM bookings. Organic leads often take longer to close, so extend your attribution window to 30–45 days.
Direct Mail Attribution: Use unique tracking phone numbers or promo codes. One operator mailed 5,000 postcards with a dedicated number and tracked 10 responses. Simple, but it works.
Avoid double counting: If a prospect clicks your PPC ad, fills out a form, then calls your LSA number the next day, which channel gets credit? Use first touch attribution for budgeting decisions (which channel introduced them) and last touch for optimization (which channel closed them). Compare both to spot assisted conversions.
Mini FAQ: HVAC Marketing Budget Questions
What percentage of revenue should an HVAC company spend on marketing?
5–12% depending on growth stage and market competition. Mature businesses in less competitive areas can sustain growth at 5–7%. New operators or those in saturated metros need 10–12% to break through. Adjust based on installer capacity (if you’re booked solid, pause budget increases until you hire).
Is SEO or PPC better for HVAC lead generation?
PPC delivers leads in days and is fully controllable. SEO takes 4–6 months to ramp but costs $10–$15 per lead once seeded versus $30–$60 for PPC. Run both: PPC for immediate volume, SEO for long term margin. Allocate 60–70% to PPC in year one, then shift to 50/50 by year two as organic compounds.
What’s a good cost per lead for HVAC?
$16–$20 for Google Local Services Ads, $30–$50 for PPC, $10–$15 for organic SEO, $40–$70 for paid social, $8–$12 for direct mail per household. Blended CPL across all channels should land at $25–$35. Anything above $50 blended signals waste or poor targeting.
What’s an acceptable CAC for an $8k install?
$600–$2,500 depending on close rate and channel mix. If your lead to install close rate is 15%, you can afford $1,200 CAC and still hit 85% gross margin. If you’re closing at 10%, CAC above $800 starts eroding margin. Improve close rates before raising CPL tolerance.
How long does it take to see ROI from HVAC marketing?
PPC and LSA deliver leads within 48 hours (first booked jobs within a week). SEO takes 4–6 months for consistent leads, 8–12 months to see compounding traffic gains. Direct mail response happens within 2–4 weeks of delivery. CTV and brand campaigns take 8–12 weeks to lift branded search volume.
Should I run marketing year round or only during peak season?
Year round with budget modulation. Cut spend by 15–20% during shoulder months and reallocate to SEO, content, and brand. Increase spend by 20–30% during peak months to capture demand spikes. Turning off marketing entirely during slow months means you’re invisible when the next heat wave or cold snap hits.
Can a small HVAC company compete with large chains on PPC?
Yes. Published case studies show small operators achieving 794–1,214% ROI on PPC. Success depends on tight keyword targeting, strong landing pages, fast CSR response, and proper tracking (not company size). Large chains often waste budget on broad match keywords and slow follow-up. Outexecute them on conversion rate and you win at lower spend.
How do I know if my marketing agency is delivering real ROI?
Demand access to your CRM data, call tracking reports, and offline conversion imports. Calculate CAC by channel yourself using leads and booked jobs, not clicks and impressions. If your agency can’t show which campaigns drove booked revenue, fire them. ROI transparency is non-negotiable.
Common Mistakes That Destroy ROI
No call tracking or CRM tagging. You’re spending $20k per month and guessing which channels work. Install call tracking with dynamic insertion and tag every CRM lead with source and campaign. Without this, you can’t calculate CPL or CAC by channel, which means you keep funding losers.
Slow CSR response times. Leads that wait 4+ hours for a callback convert at half the rate of sub 90 second responses. If your team can’t answer the phone during business hours, hire an answering service or pause lead generation until you fix follow-up.
No offline conversion imports into Google Ads. Google optimizes for clicks and form fills, not booked revenue. If you don’t tell Google which clicks turned into $8k installs, it keeps sending traffic that fills your CRM with junk. Export booked jobs weekly and import as offline conversions.
Ignoring seasonality. Running the same budget and bids year round wastes money in shoulder months and loses share in peak season. Modulate spend 30–60 days ahead of demand curves: increase 20–30% before summer and winter, decrease 15–20% in spring and fall.
Thin spend across too many channels. Spreading $10k across PPC, LSA, SEO, social, direct mail, and aggregators means none get enough budget to perform. Pick two or three channels, fund them properly, and add channels only after you’ve maxed ROI on the first set.
Conclusion: Operationalize Your Budget Into $8k+ Installs
Budgets don’t book jobs. Budgets fund lead flow, and your team converts leads into revenue. The tier you choose matters less than how well you track, respond, and close. A $15k budget with a 15% close rate and 90 second CSR response beats a $50k budget with a 10% close rate and 4 hour callbacks.
Start by auditing your conversion funnel. Measure lead to appointment and appointment to close rates by channel. Identify where leads leak, fix follow-up speed and CSR scripts, then scale budget into your best performing channels. Use the Decision Guide at the top of this article to pick your tier, then allocate by the channel splits we’ve outlined.
Track everything. Import offline conversions weekly. Run monthly attribution reviews. Modulate spend ahead of seasonal swings. Your competitors are guessing. You’re going to measure, optimize, and win on realized ROI, not vanity metrics like impressions or clicks. Ready to build a marketing stack that books more jobs?
About the Author
Ben Desjardins is a three-time founder, published marketing author, and the driving force behind Sure Shot Systems, a digital marketing agency that brings Fortune 500 strategy to HVAC contractors and home service businesses at small-business pricing. With over 20 years of hands-on experience building and scaling marketing operations for local contractors, Ben has guided companies from their first $5,000 test budget to six-figure monthly ad spends that generate consistent, profitable install volume.
His expertise centers on the budget allocation frameworks and conversion funnel optimization outlined in this article: goal-backed budgeting tied to installer capacity, seasonal spend modulation, channel-specific CPL benchmarks, and tracking infrastructure that proves which dollars drive booked jobs. Sure Shot Systems' clients, spanning HVAC, roofing, flooring, painting, and other trades, consistently outperform industry averages because Ben's team operates with one non-negotiable standard: fast, measurable ROI or you walk away.
Unlike traditional agencies that require long-term contracts and bury clients in jargon, Sure Shot Systems runs month-to-month engagements with full transparency. Most clients recover their investment within 30 days, reduce acquisition costs by 80%+ versus aggregator leads, and gain direct access to senior marketing strategists who understand contractor operations inside and out. Ben's budget planning methodologies and ROI case studies are trusted by home service businesses nationwide who demand accountability, not excuses. Connect with Ben on LinkedIn.


Got a question?
Send us a message. We're happy to help.
