
Ben Desjardins
Shopping for an HVAC marketing agency shouldn’t feel like guessing your way through a labyrinth of retainers, commissions, and vague promises. Yet most commercial contractors waste weeks comparing proposals that bury real costs under buzzwords and opaque deliverables. This guide cuts through the noise with hard numbers, realistic benchmarks, and the pricing levers you can actually negotiate.
Whether you’re a regional contractor chasing 30% YoY lead growth or a multi-division enterprise qualifying six-figure design-build bids, you’ll walk away knowing exactly what to pay, what to expect, and how to measure return. We’ll unpack monthly retainers from $5k to $25k+, decode performance-based math, and show you the budget frameworks that align marketing spend with revenue targets. No fluff, just the pricing intelligence you need to make a confident decision.

TL;DR: 2026 Pricing at a Glance
If you’re skimming for the bottom line, here’s the snapshot. Most commercial HVAC contractors pay between $5,000 and $12,000 per month for agency retainers that cover PPC, SEO, LinkedIn ABM, and content. Enterprise multi-division shops can hit $15,000 to $25,000 when creative, sales enablement, and data integrations enter the picture. Performance-based deals layer incentives on top of base fees, typically $300 to $800 per qualified SQL in commercial markets, or a percentage of closed revenue ranging from 8% to 15% with attribution windows and clawbacks.
Budget planning starts with allocating 7% to 10% of annual revenue and splitting it between media spend and agency fees at ratios between 3:1 and 6:1. A $5M contractor, for instance, might reserve $350,000 to $500,000 annually. Then divide that into $250,000 for PPC and LinkedIn ads plus $100,000 to $150,000 for management and content. Payback windows for service contracts run 3 to 8 months, while plan-spec bids stretch to 12+ months given longer sales cycles and higher average contract values.
Pricing Tier | Monthly Range | What’s Included | Best Fit |
|---|---|---|---|
Essentials | $5k–$7k | Foundational PPC, core SEO, 1–2 content assets, call tracking | Regional contractors, single market, M&R focus |
Growth | $8k–$12k | Increased media management, LinkedIn ABM, CRO/landing page tests, 3–4 content pieces | Multi-market expansion, higher deal values, design-build mix |
Enterprise | $15k–$25k+ | Custom strategy, creative studio, sales enablement, compliance reporting, data integrations | Multi-division, procurement protocols, complex bid environments |
Performance Hybrid | Base + incentives | Retainer plus $300–$800/SQL or 8–15% revenue share | Proven funnels, high data quality, clear attribution |
This table gives you a sanity check before you even request a proposal. If an agency quotes $3,000 per month promising the moon or asks for $20,000 without a clear enterprise playbook, you know to ask harder questions. The rest of this guide unpacks each tier, shows you the line items, and equips you with the ROI benchmarks that separate smart investment from wishful thinking.
How Commercial HVAC Retainers Are Structured (and What’s Included)
Retainer models wrap scope, channel mix, and SLAs into a recurring fee that keeps your pipeline humming month after month. In 2026, expect most B2B-focused agencies to anchor between $5,000 and $12,000 monthly for contractors running multi-market operations or targeting commercial property managers and general contractors. That range reflects the workload of managing PPC campaigns across Google, Bing, and LinkedIn, producing technical content that speaks to facility directors, and maintaining a CRM-integrated attribution stack.
Core inclusions at the mid-tier level usually cover search and social ad buys, on-page SEO for service pages and case studies, two to four blog posts or case studies per month, monthly reporting with SQL attribution, and basic call tracking with recording review. Optional add-ons that bump the invoice include landing page design and A/B testing, video shoots for testimonials or walkthroughs, geofencing for competitor sites or trade shows, and advanced CRM integrations that auto-score leads by job size and zip code. Agencies build these packages around SLAs tied to response time for bid requests, minimum content refresh cycles, and monthly creative tests to keep conversion rates climbing.
Geography and vertical also shift the dial. An agency serving a Florida contractor competing for data center HVAC retrofits will allocate more budget to LinkedIn Sponsored InMail and compliance-heavy case studies than one chasing restaurant equipment service in a rural market. The same $10,000 retainer buys different channel weights depending on where your prospects hang out and how long your sales cycle runs.
Tier 1: $5k–$7k/Month, Essentials for Regional Contractors
This entry tier targets single-market or regional contractors focused on maintenance agreements and lighter commercial installs under $50,000. You’ll get lean but disciplined execution: Google Ads campaigns in two to three service categories with geo-targeting down to zip or radius, foundational on-page SEO for priority pages like “commercial HVAC maintenance” and “emergency repair,” one to two blog posts or landing pages monthly, and call tracking with basic keyword-level attribution.
What you won’t get at this price point is extensive creative testing, LinkedIn prospecting, video production, or deep CRM workflow automation. Reporting stays straightforward (monthly dashboards showing spend, clicks, call volume, and a handful of form fills). If your sales team closes deals on gut and handshake more than formal pipeline stages, this tier keeps lead flow steady without overwhelming your intake process.
Outcomes at $5k to $7k hinge on having a conversion-ready website and a sales process that can handle 15 to 30 inbound calls per month. Agencies won’t rebuild your site or re-engineer your CRM at this level. They’ll drive traffic and capture contact info, but closing responsibility sits squarely on your shoulders. Expect CAC in the $400 to $700 range for service contracts if your close rate hovers around 20% to 30%. Understand that ramping from zero takes 60 to 90 deals before momentum feels real.
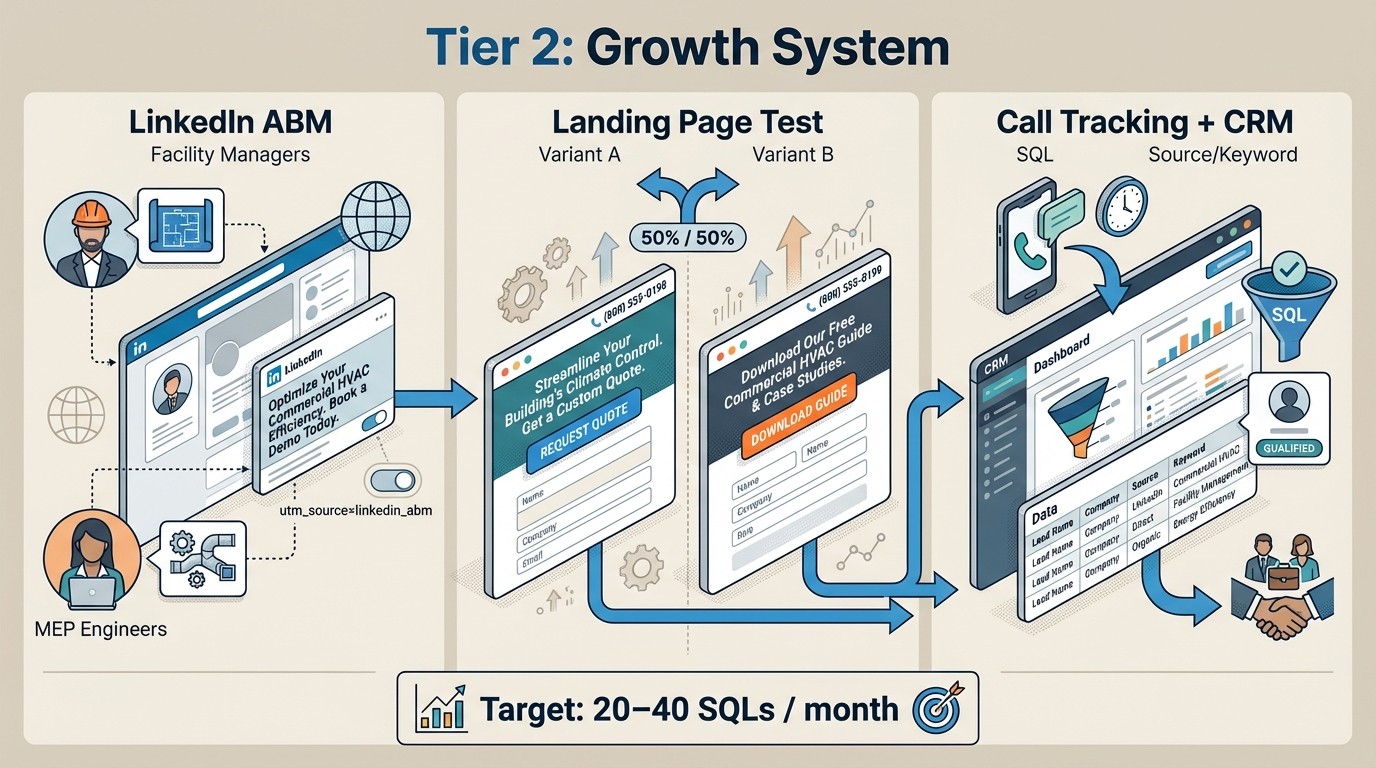
Tier 2: $8k–$12k/Month, Growth Package for Multi-Market
Step into the $8,000 to $12,000 band and the dial turns toward scale and sophistication. Media budgets climb (often to $15,000 to $40,000 monthly across Google, Bing, and LinkedIn), which means more ad creative variants, audience segments, and bid strategies that adjust by time of day or device. The agency layers in ABM tactics on LinkedIn, targeting facility managers at specific property management firms or mechanical engineers at design-build GCs, complete with sponsored content and InMail sequences that nurture over weeks.
Content production jumps to three or four high-value pieces per month: technical blog posts that answer common RFP questions, case studies formatted for plan-spec qualifications, and possibly a quarterly white paper or maintenance checklist that captures emails. CRO becomes a recurring line item, with A/B tests on landing page headlines, form fields, and CTA placement driving incremental lift in conversion rates. Call tracking gets smarter too, with dynamic number insertion, recording transcription for quality scoring, and integration into your CRM so every lead carries source, keyword, and call quality tags.
SLAs at this tier typically promise creative refreshes every 45 to 60 days, monthly strategy calls with your sales or ops lead, and quarterly performance reviews that map SQLs and closed deals back to campaigns. Agencies expect pipeline impact to show within 90 to 120 days, with steady monthly SQL volumes in the 20 to 40 range if your market and close rates cooperate. You’re not just buying lead flow here. You’re buying systematic testing and optimization that compounds over six to twelve months. If your average commercial contract sits between $50,000 and $150,000, the added cost pays for itself when even one or two extra closes land per quarter.
Enterprise: $15k–$25k+/Month, Complex, Multi-Division Bids
Enterprise retainers aren’t just bigger, they’re architecturally different. At $15,000 to $25,000 monthly, agencies staff dedicated strategists, creative directors, and data analysts who function as an extension of your leadership team. You’ll see custom campaign strategies per division (maybe one playbook for your controls and automation group chasing hospital retrofits and another for your new-construction HVAC targeting data centers or manufacturing plants).
Creative becomes a continuous production line: video testimonials shot on-site, animated explainer reels for LinkedIn, custom infographics for RFP appendices, and branded templates that match your corporate identity guidelines. Sales enablement enters the scope too (one-pagers for account executives, ROI calculators hosted on landing pages, and trade show collateral that maintains brand consistency across regions). Data integration work ties your CRM to marketing automation platforms and attribution tools so every touchpoint (from first ad click to signed contract) flows into a unified reporting layer that satisfies CFO-level scrutiny.
Compliance and procurement needs drive additional cost at this level. Multi-stakeholder reporting means dashboards segmented by region, division, and service line, often delivered in formats that plug straight into board decks or investor updates. Agencies may also manage relationships with third-party data providers for firmographic targeting or handle RFP responses for your marketing scope when you’re bidding alongside other trades. Expect onboarding to stretch 45 to 60 days, with discovery sessions that involve your finance, sales, and ops leaders mapping attribution logic and pipeline definitions before the first campaign fires. The payoff is a machine that scales across markets without you rebuilding strategy from scratch each time.
Performance-Based Models for HVAC: How They Work and What They Cost
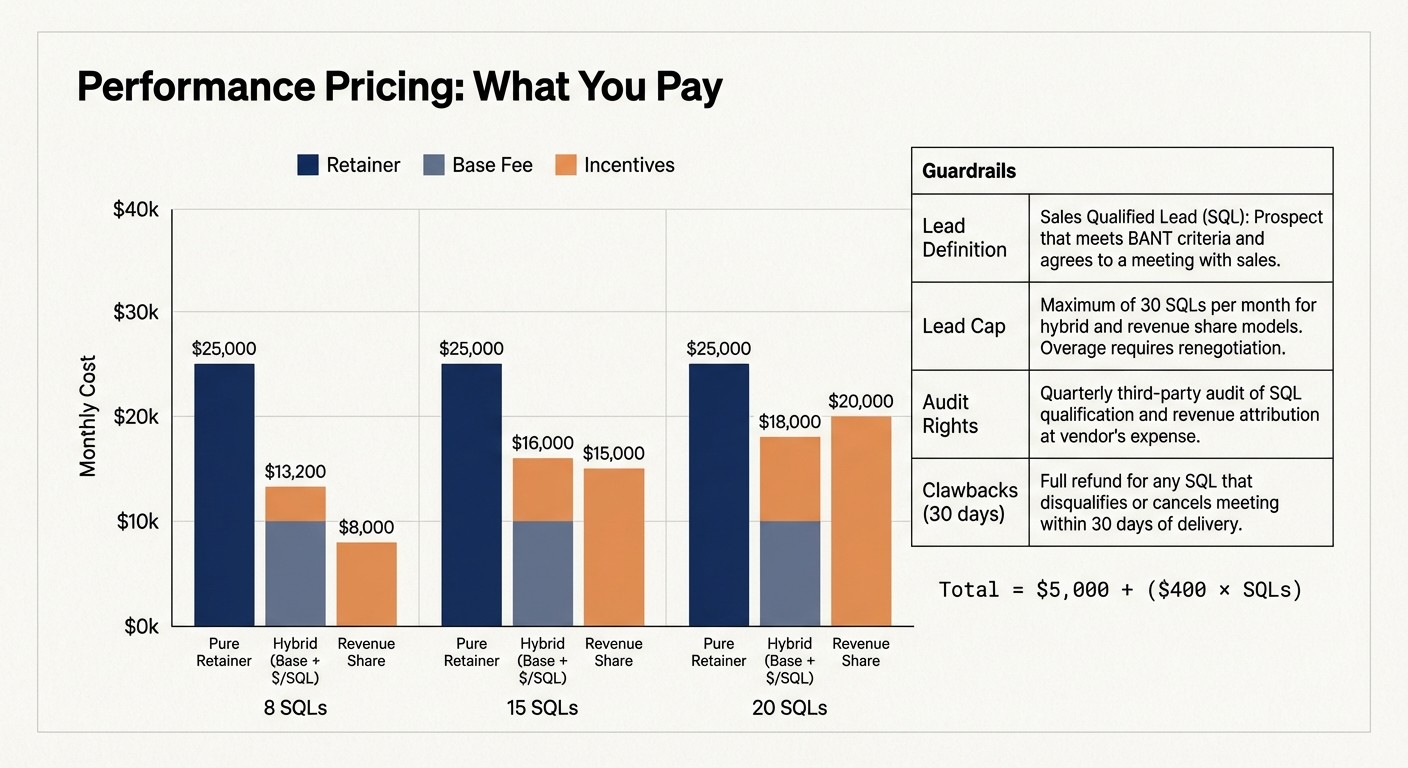
Performance-based pricing layers incentives on top of a base retainer or replaces it entirely, tying agency compensation to measurable outcomes like qualified leads, sales opportunities, or closed revenue. The most common hybrid in 2026 pairs a reduced monthly retainer (often 40% to 60% of a traditional fee) with per-lead or per-opportunity bonuses. A contractor paying $8,000 per month on a pure retainer might instead pay $4,000 base plus $500 per qualified SQL, capping the agency’s upside at 20 leads monthly to keep total spend predictable.
Math example: Your full retainer quote is $10,000. The agency proposes a $5,000 base plus $400 per SQL. If they deliver 15 SQLs in a month, you pay $5,000 + ($400 × 15) = $11,000. If they deliver only 8, you pay $5,000 + ($400 × 8) = $8,200. You’re protected on the downside and aligned on the upside, but clarity on what counts as “qualified” matters more than the rate itself.
Guardrails keep both parties honest. Lead definitions must specify minimum contract value, decision-maker contact level, geographic boundaries, and service categories. A $400-per-lead deal falls apart fast if the agency floods you with residential inquiries or tire-kickers asking for free quotes on $2,000 compressor swaps when your target is $50,000+ installs. Lead caps prevent runaway invoices, audit rights let you spot-check recordings and CRM entries, and clawback clauses recover fees if a lead turns out to be spam or a duplicate within 30 days.
Pay-Per-Lead vs Pay-Per-Opportunity (SQL): Definitions and Average Rates
Pay-per-lead pricing compensates the agency for any contact that meets baseline criteria: valid phone number, commercial address, request related to your service area, and some signal of near-term intent like “need estimate this month.” In 2026, commercial HVAC pay-per-lead rates cluster between $150 and $400, skewed higher in dense metros where CPCs for “commercial HVAC installation” exceed $50. This model suits contractors with strong inside sales teams who can qualify and convert raw inquiries efficiently, but it shifts qualification burden to you.
Pay-per-opportunity (or pay-per-SQL) raises the bar and the rate. An SQL must include a named decision-maker, a defined project scope or problem statement, a budget or contract size indication, and a timeline within 90 days. Agencies vet these before counting them toward payout, often through recorded calls or form data review. Expect $300 to $800 per SQL in commercial markets, with industrial or plan-spec opportunities at the higher end due to longer qualification cycles and higher ACVs.
Geography and vertical bend these ranges. A Phoenix contractor chasing data center cooling can pay $700 per SQL because the competition and media costs are brutal. A contractor in Boise targeting retail HVAC maintenance might see $350. Industrial leads (warehouse builds, hospital retrofits) lean toward $600 to $800 because the sales cycle stretches and the technical vetting is heavier, while straightforward M&R contracts for offices or restaurants sit closer to $300 to $450. Ask agencies to show historical close rates by lead type so you can reverse-engineer whether their SQL definition aligns with what your sales team actually closes.
Revenue-Share and Pipeline-Commission Variants
Revenue-share models take performance alignment to the next level by tying agency fees directly to closed deals. Common structures range from 8% to 15% of contract value, paid when the deal closes and the first invoice clears. A $100,000 design-build project at 10% revenue-share nets the agency $10,000, often split into an upfront payment at contract signing and a balance 30 days post-installation to guard against cancellations or chargebacks.
Attribution windows define how long the agency gets credit for a lead. Most agreements grant 180 to 365 days from first touch. So if a prospect clicks an ad in March, requests a quote in May, and signs in October, the agency still earns the share. Tiered splits can reward faster closes: 12% if the deal closes within 90 days, 10% within 180 days, 8% beyond that. This nudges the agency to prioritize high-intent campaigns and tight follow-up rather than hoping long-tail SEO eventually pays off.
Clawback clauses protect you if a customer cancels within 30 to 60 days or if the contract value drops during negotiation. If a $120,000 project gets value-engineered down to $80,000 before signing, the revenue-share recalculates to the lower figure. If the client bails after one month of a three-year maintenance agreement, many contracts pro-rate the commission or void it entirely. Timing matters too: agencies typically invoice 30 to 45 days post-close to let your finance team confirm the deal is real and funded. This model works brilliantly when trust is high and attribution is airtight, but it demands rock-solid CRM hygiene and transparent sales reporting.
When a Pure Performance Deal Is Realistic (and When It Isn’t)
Pure performance deals (zero base retainer and 100% tied to outcomes) sound ideal until you map the risk. They’re realistic when you have a proven funnel with documented conversion rates, at least six months of historical lead and close data, and sufficient media budget to let the agency test and scale without gambling their own cash. If your CRM shows that 25% of SQLs close at an $80,000 ACV and your CAC hovers around $2,500, an agency can confidently bid a revenue-share knowing the math pencils.
They fall apart in new markets where you lack baseline data, when your sales process is inconsistent or your close rates swing wildly month to month, or when you can’t commit to a media budget that gives campaigns room to breathe. An agency taking 100% performance risk in a cold market with no attribution infrastructure is either underpricing the risk or planning to flood you with junk leads to hit volume targets. If you’re launching in a new geography, entering a new vertical like industrial or healthcare, or overhauling your sales process mid-contract, a hybrid model with a base retainer plus performance kickers is the safer bet.
Another red flag: severely mispriced risk. If an agency offers pure performance with no media budget contribution from you, they’re either running wafer-thin margins on recycled leads or they’ll pivot to cheaper, lower-quality sources the moment volume dips. Realistic performance deals still require you to fund the ad spend. The agency’s fee becomes variable, not the fuel that drives the machine. Make sure your contract spells out who owns the media budget, how overage approvals work, and what happens if cost-per-click spikes unexpectedly mid-quarter.
Budget Alignment: 7–10% of Revenue and Media-to-Fee Ratios
Smart HVAC contractors anchor marketing spend at 7% to 10% of annual revenue, a range that balances growth ambition with operational reality. A $5 million contractor allocates $350,000 to $500,000 yearly, a $10 million shop budgets $700,000 to $1 million. That total splits between media spend (the cash that buys ads and sponsorships) and agency fees (the cost of strategy, creative, and execution). Industry norms suggest media-to-fee ratios between 3:1 and 6:1, so if you’re spending $30,000 monthly on PPC and LinkedIn, expect agency management fees between $5,000 and $10,000.
Here’s a quick walkthrough with sample math. Say your annual revenue target is $8 million. At 8%, you allocate $640,000 for the year, or roughly $53,000 per month. If you aim for a 4:1 media-to-fee ratio, you’d split that into $42,400 monthly media and $10,600 in agency fees. Over twelve months, that’s $508,800 in ad spend and $127,200 in retainers. Adjust the ratio based on your growth stage: early-stage contractors pushing hard into new markets might run 3:1 to fuel aggressive testing, while mature operators optimizing existing campaigns can stretch to 5:1 or 6:1.
This framework prevents the twin traps of underfunding and overpaying. Underfunded campaigns throttle at low daily budgets, never reaching the volume needed for statistical significance in A/B tests or audience expansion. Overpaying on fees relative to media means you’re covering overhead without enough fuel in the tank to drive results. Lock in your revenue target, apply the 7% to 10% guideline, then negotiate the media-to-fee split before you even look at specific channel tactics. It’s the financial scaffolding that keeps every other pricing conversation grounded.
Sample Allocations by Channel (PPC, LinkedIn, SEO, Content)
Channel mix shifts with growth stage and sales cycle length. Early-stage contractors chasing immediate pipeline lean heavily into PPC and LinkedIn (often 60% to 70% of total media) because these channels deliver near-term SQLs. You’re buying visibility in high-intent searches like “commercial HVAC contractor Chicago” or targeting facility managers at specific property groups with Sponsored InMail. SEO and content take the remaining 30% to 40%, building domain authority and long-tail traffic that compounds over quarters.
As you mature and your brand recognition grows, flip the weighting. Established contractors might run 40% PPC and LinkedIn for sustained lead flow, 35% into SEO and organic content to capture lower-funnel searches without ongoing CPC pressure, and 25% into remarketing, email nurture, and trade show amplification. Long sales cycles (think plan-spec bids or multi-year maintenance contracts) justify heavier content investment because decision-makers research for months before they even issue an RFP.
Practical split for a $50,000 monthly budget at mid-stage growth: $20,000 Google and Bing PPC across service and geo campaigns, $12,000 LinkedIn Sponsored Content and InMail targeting ABM accounts, $10,000 SEO retainer covering technical audits, on-page optimization, and link building, $8,000 content production for blogs, case studies, and landing pages. The rationale here is that PPC and LinkedIn feed your pipeline today, while SEO and content reduce your future CAC by capturing organic traffic that doesn’t reset to zero when you pause ad spend. Track blended CAC across all channels quarterly to see whether your mix is optimizing for short-term survival or long-term compounding.
Seasonal PPC Ramps for Heating/Cooling Cycles
HVAC demand swings with the thermometer, and your PPC budget should too. Peak cooling season in June through August and peak heating in December through February see CPC inflation of 20% to 40% as every contractor floods the zone. Smart operators ramp bids and budgets 30 to 45 days ahead of peak to capture early-bird shoppers and prequalify installs before the rush. Then ease off in shoulder months like April, May, September, and October when competition thins.
Service and maintenance work offers a counter-cyclical play. While emergency repair and new install CPCs spike in extreme weather, planned maintenance and tune-up campaigns cost less and smooth your pipeline through slower months. Run remarketing and nurture campaigns targeting past customers with “spring maintenance special” or “fall system check” offers at 50% to 60% of peak-season CPC. This keeps technicians scheduled and cash flow steady without burning budget in bidding wars you can’t win.
B2B project work (design-build or plan-spec) follows a different calendar tied to fiscal years and construction seasons. Many commercial property budgets reset in Q1 or Q4, so LinkedIn and content campaigns should peak in late Q4 and early Q1 to position your firm when RFPs drop. Allocate 15% to 20% more budget to these windows and pull back in summer months when decision-makers vacation and projects stall. Use historical CRM data to map your close dates back to first touch, then lead your budget ramps by that lag time so campaigns hit full stride exactly when prospects start searching.
Multi-Location vs Single-Market Budget Nuances
Expanding into multiple markets doesn’t just multiply your spend, it changes the economics of creative, targeting, and attribution. Geo expansion forces you to research local CPCs, competitor intensity, and regulatory quirks like licensing or permitting language that varies by state. A campaign crushing it in Dallas might flop in Denver because search volume, seasonality, or commercial construction cycles differ. You’ll need geo-specific landing pages, local phone numbers for call tracking, and possibly separate ad groups with localized copy (all of which add creative and QA hours).
Shared creative efficiencies do exist. A case study or video testimonial produced for your Atlanta market can often be repurposed with minor tweaks for Charlotte or Nashville, amortizing production cost across regions. Centralized strategy and reporting dashboards scale more cheaply than building from scratch in each market. But don’t assume linear savings: your third market costs more per incremental dollar than your first because you’re managing coordination complexity, not just cloning a playbook.
Localization needs drive where savings evaporate. If each market demands unique service mixes (one focuses on data center cooling, another on hospitality HVAC), you lose template advantage and need bespoke messaging. Competitive landscapes vary too. Entering a market where a dominant local player owns the top organic spots means higher PPC spend and slower SEO ramp. Budget 20% to 30% more per new market in year one to cover discovery, creative localization, and the learning curve, then reassess once you have six months of performance data to optimize against.
ROI Benchmarks Contractors Should Expect
Realistic ROI hinges on three core metrics: CAC (Customer Acquisition Cost), LTV (Lifetime Value), and payback period (the months it takes for gross profit from a new customer to recover your acquisition cost). CAC is your total marketing and sales expense divided by new customers won. LTV is the total gross profit a customer generates over the relationship, factoring in initial contract value, renewal rates, upsell opportunities, and churn. Payback period tells you how fast your cash flow recovers so you can reinvest in growth.
For commercial HVAC service contracts, expect CAC between $1,500 and $4,000 depending on market density and close rates. If your average service agreement runs $8,000 annually at 35% gross margin, that’s $2,800 gross profit per year. A $2,500 CAC pays back in under eleven months, leaving years of profit if your retention rate stays above 70%. Plan-spec and design-build bids run higher CACs (often $5,000 to $12,000) because win rates drop to 10% to 20% and sales cycles stretch six to eighteen months, but ACVs of $150,000 to $500,000+ with 20% to 25% margins justify the investment.
Finance and marketing must agree on these definitions up front or you’ll argue over what counts as “cost” and “customer.” Include agency fees, media spend, sales salaries, CRM software, and call tracking in your CAC numerator. Count only closed, invoiced customers in the denominator (not MQLs or even SQLs that never convert). LTV should reflect contract renewals, maintenance add-ons, and referral economics, not just the first sale. This clarity prevents the agency from gaming metrics with vanity wins like “leads generated” while your bank account bleeds.
Benchmarks for Service/M&R Contracts
Service and maintenance agreements offer the fastest payback because sales cycles run 30 to 90 days and close rates for warm inbound leads hit 25% to 40%. Typical cost per SQL ranges from $300 to $600 in competitive metros, so if you close 30% of SQLs, your CAC lands between $1,000 and $2,000. Average deal size for annual maintenance contracts clusters around $5,000 to $12,000, with gross margins of 30% to 40% after labor and parts. That translates to $1,500 to $4,800 gross profit in year one.
Contract longevity drives LTV higher. If your average maintenance customer sticks for three years and you upsell 40% into equipment replacement or IAQ upgrades worth another $15,000 at 25% margin, your LTV jumps to $10,000 or more. That makes a $2,000 CAC look brilliant with a 5:1 LTV-to-CAC ratio and a payback period under six months. The importance of maintenance agreements isn’t just predictable revenue, it’s the upsell pathway that multiplies LTV without additional acquisition cost.
Track renewal rates and upsell penetration monthly (not annually) to catch churn before it craters your LTV assumptions. If your retention drops from 75% to 60%, your three-year LTV model collapses and suddenly a $1,800 CAC doesn’t pencil anymore. Use CRM flags to identify at-risk accounts and trigger win-back campaigns or service recovery before the contract lapses. The contractors who nail service/M&R benchmarks obsess over post-sale experience as much as pre-sale marketing, because retention is cheaper than acquisition every single time.
Benchmarks for Plan/Spec and Design-Build Bids
Plan-spec and design-build work operates in a different universe. Sales cycles stretch six to eighteen months from first RFP to contract signature, win rates hover between 10% and 25% because you’re competing against three to five qualified bidders, and decision committees involve facility managers, MEP engineers, GCs, and procurement teams who all wield veto power. Your CAC climbs to $5,000 to $12,000 per closed deal (sometimes higher if you’re breaking into hospital, data center, or government work where prequalification alone costs thousands in documentation and bonding).
Average contract values justify the pain: $150,000 to $500,000+ for multi-phase retrofits, new construction installs, or multi-year service bundles tied to capital projects. Gross margins run 20% to 25% (tighter than service work because competitive bidding squeezes pricing and scope creep is common). A $300,000 project at 22% margin yields $66,000 gross profit. If your CAC is $8,000, payback happens in roughly two months of project billing, but your cash is tied up for the full cycle, so working capital and project finance become constraints.
Prequalification lists and GC relationships shift pipeline conversion dramatically. Getting on an owner’s approved vendor list or a GC’s preferred subcontractor roster cuts your effective CAC by 30% to 50% because you skip the cold prospecting phase and enter at RFP stage with built-in credibility. LinkedIn ABM campaigns targeting procurement and engineering contacts at target GCs or property groups, paired with case studies and technical white papers that demonstrate past performance, are worth their weight in gold at this level. Track not just closed deals but also prequalification wins and shortlist appearances to measure upstream pipeline health.
Attribution and Call Tracking Requirements to Measure ROI
Proving ROI demands a tracking stack that follows the customer from first click to signed contract. In HVAC where 60% to 80% of commercial leads start with a phone call, that means call tracking with recording, transcription, and CRM integration. Dynamic number insertion swaps unique phone numbers onto your landing pages based on traffic source, so you know whether that $75,000 chiller replacement came from a Google ad, a LinkedIn post, or an organic search. Without it, you’re flying blind and probably over-crediting whatever channel the customer mentioned last.
CRM attribution ties each lead to campaign, keyword, ad creative, and landing page, then tracks progression through your pipeline stages: MQL, SQL, proposal, negotiation, close. UTM discipline (consistent tagging on every link in every email, social post, and ad) ensures data flows cleanly into your CRM and analytics platforms. If your sales team bypasses CRM and closes deals off spreadsheets or memory, your attribution model is fiction and your agency can’t optimize spend.
Budget $200 to $500 monthly for call tracking software like CallRail or CallTrackingMetrics, another $100 to $300 for CRM seat licenses and integrations, and allocate QA time weekly to audit lead sources and recording quality. Spot-check 10% of recorded calls to verify that tracked keywords and campaigns match what the caller actually says. Hire a virtual assistant or ops coordinator to tag untagged leads and reconcile closed deals back to original source before month-end reporting. This operational rigor separates contractors who know their CAC from those who guess, and it’s the foundation every performance-based deal relies on to calculate payouts fairly.

Commercial vs Residential Pricing: Why B2B Costs More
B2B marketing fees run 30% to 60% higher than residential because the work is fundamentally more complex. Here’s why:
Longer sales cycles mean campaigns must nurture for three to eighteen months instead of days or weeks, requiring drip email sequences, remarketing budgets, and content that speaks to multiple stakeholders.
Multi-stakeholder buying committees force messaging that satisfies facility managers, CFOs, MEP engineers, and GCs simultaneously (each with distinct pain points and approval criteria).
Account-based marketing data costs real money. LinkedIn Sales Navigator, Bombora intent data, and firmographic enrichment tools add $500 to $2,000 monthly in software and list fees.
Compliance and documentation requirements for plan-spec bids or government RFPs demand case studies, certifications, safety records, and insurance proofs formatted to spec (not generic blog posts).
Higher media CPCs in commercial categories like “commercial HVAC installation” or “industrial chiller service” often run $40 to $100+ per click versus $10 to $30 for residential HVAC.
Creative needs include technical explainer videos, engineering white papers, ROI calculators, and trade show collateral that residential campaigns skip entirely.
These aren’t soft differences, they’re hard costs and time sinks that show up in every agency invoice. A residential HVAC campaign optimized for “furnace repair near me” can run profitably at $3,000 to $5,000 monthly because the creative is simple, the sales cycle is tight, and the targeting is zip code plus season. Commercial work demands strategic depth and channel diversification that residential operators rarely need. If an agency quotes the same price for both, they’re either underpricing B2B or overcharging residential. Walk away either way.
Pricing Variables That Move Your Quote Up or Down
When an agency sizes your proposal, they’re evaluating risk and workload through a set of levers. Here’s what moves the number:
Number of markets or locations: Each new geo adds research, localized creative, separate tracking numbers, and reporting complexity.
Service line diversity: Covering HVAC, controls, IAQ, refrigeration, and energy management in one campaign quintuples messaging variants versus a single-service play.
Sales cycle length: Six-month cycles require deeper remarketing pools and more content than 30-day close windows.
Existing marketing infrastructure: A turnkey CRM with attribution, a conversion-optimized website, and historical campaign data cut onboarding time and derisk performance.
Creative assets on hand: If you supply professional photography, video testimonials, and case studies, the agency skips production costs.
Competitor intensity: Saturated metros like New York or Los Angeles push CPCs and SEO difficulty higher, forcing bigger media budgets and longer ramp times.
Internal team capacity: Agencies charge less when you have a marketing coordinator who can approve ads fast, review content drafts, and manage CRM hygiene, because they spend less time herding cats.
If you walk in with a single-market service business, a dialed CRM, and a responsive internal point person, you’ll land at the lower end of any pricing range. If you’re launching three new regions with no brand recognition, a WordPress site from 2015, and a sales team that ignores CRM, expect the top of the range or higher. Ask agencies which variables matter most in their model so you can negotiate intelligently or fix gaps before you sign.
Contracts, SLAs, and Ramp Timelines
Most agencies require six to twelve-month minimum terms because marketing takes time to compound. PPC campaigns need 30 to 60 days to gather enough conversion data for algorithmic bidding to stabilize. SEO work won’t move the needle in organic rankings for 90 to 120 days. Content published in month one generates traffic and backlinks for quarters or years, but the payoff isn’t immediate. Contractors who bail at month three (right when performance is about to inflect) waste spend and never see ROI.
Onboarding speed depends on complexity. A single-market PPC retainer can launch in two weeks if your tracking and landing pages are ready. A multi-division enterprise deal with custom CRM integrations and compliance reviews stretches 45 to 60 days. Realistic time-to-results (when you see steady SQL flow matching projections) runs 90 to 180 days to reach what agencies call “steady state.” Front-load patience in your planning. If you need leads next month, sign the contract three months ago or set a lower bar for interim metrics.
SLAs that actually protect outcomes focus on inputs and responsiveness, not fantasy guarantees like “page one rankings in 60 days.” Look for commitments on creative refresh cycles every 45 to 60 days, response time to your requests within 24 to 48 business hours, monthly strategy calls, and adherence to lead qualification definitions. Vanity SLAs like “10% CTR improvement” sound impressive but don’t pay your bills. SQL volume, CAC trends, and close rates do.
What a 30/60/90 Onboarding Should Include
A well-structured onboarding builds your foundation in 30 days, tests and learns in 60, and hits stride by 90. Here’s the roadmap:
Days 1–30 (Discovery and Setup): Kickoff call with your sales and ops leads to map customer journey, ICP, and pipeline definitions. Analytics and call tracking install with UTM schema and CRM integration. Competitive audit of local PPC landscapes and SEO gaps. Creative brief and asset inventory to identify what you have and what needs production. First campaign builds in Google Ads and LinkedIn with geo, keyword, and audience targeting locked.
Days 31–60 (Launch and Test): Campaigns go live with initial budgets at 70% to 80% of planned spend to allow for learning. A/B tests on ad copy, landing page headlines, and form lengths begin collecting data. First content pieces publish: one high-value blog post or case study and landing page variants. Weekly check-ins to review early metrics, CTRs, CPC trends, and call quality. Initial lead flow starts (expect 30% to 50% of target volume as algorithms optimize).
Days 61–90 (Optimize and Scale): Winning ad variants get budget increases, losers get paused. SEO on-page recommendations implemented and first backlink outreach initiated. Remarketing audiences built from site visitors and call lists. Monthly reporting package delivered with SQL attribution and CAC calculation. Full target budget deployed as conversion data stabilizes. By day 90, you should see consistent weekly SQL flow, a clear CAC trend, and a backlog of tests queued for the next quarter. If you don’t, schedule a strategy reset to diagnose whether targeting, creative, or internal sales process is the bottleneck.
Reporting Cadence and KPI Commitments
Monthly executive rollups should land by the fifth business day of the new month, giving your leadership team a clean look at spend, SQLs, CAC, pipeline value added, and closed revenue attributed to marketing. These reports need to be concise: one-page dashboard plus three to four slides drilling into channel performance, creative tests, and next month’s plan. Weekly tactical notes (brief email or Slack updates on budget pacing, creative approvals needed, and any anomalies like CPC spikes or site downtime) keep you in the loop without drowning you in data.
Define a few core KPIs that map directly to revenue and hold the agency accountable: total SQLs delivered, CAC by channel, SQL-to-close conversion rate, and pipeline value created. Encourage clarity on stage definitions so an SQL in your CRM matches an SQL in the agency’s report. Disagreements over what counts torpedo trust fast, so co-author a lead taxonomy document in week one that specifies minimum contract size, decision-maker contact level, and timeline to count as qualified.
Avoid the trap of tracking 47 metrics that no one acts on. If you’re not going to change budget allocation or creative based on bounce rate, stop reporting it. Pick five to seven KPIs, set thresholds for red/yellow/green performance, and use the monthly meeting to decide what to do differently (not just admire charts). This discipline keeps the agency focused on outcomes and gives you leverage if performance slips below agreed minimums.
Exit Clauses and Make-Goods That Protect You
Fair termination windows typically require 30 to 60 days’ written notice after the initial commitment period, giving both sides time to wrap campaigns, transfer assets, and close out reporting. Avoid contracts that auto-renew without explicit opt-out windows. You want the choice to continue or walk every six or twelve months based on results, not inertia.
Underperformance remedies should spell out what happens if the agency misses SLA commitments or SQL targets two months running. Common make-goods include fee reductions, bonus creative production, or extended terms at no additional cost. Be wary of vague language like “best efforts to improve.” Instead, negotiate specific credits like one month at 50% fee or an additional $5,000 in media spend at the agency’s expense.
IP ownership at offboarding matters more than most contractors realize. Your contract should state that you own all creative assets (including ad copy, landing pages, graphics, and video) plus access to campaign historical data and call recordings. If the agency retains ownership, you lose the ability to hand off to a new partner without starting from zero. Ask for a final data export that includes campaign structures, keyword lists, audience segments, conversion tracking setup, and six months of performance CSVs so your next agency or internal team can hit the ground running.
Hidden Fees and Scope Creep: What to Watch For
Landing page design and development sits in a gray zone. Some agencies include two or three pages in the retainer, others charge $1,500 to $4,000 per custom page with responsive design and form integrations. If you need five service pages, three location pages, and two case study templates, suddenly you’re adding $15,000 to $30,000 in one-time costs before the first ad runs.
Video production for testimonials, explainer reels, or site tours costs real money: $2,000 to $5,000 for a single professionally shot and edited piece (more if you want motion graphics or multiple shoot days). Stock footage and DIY smartphone videos can plug gaps cheaply, but polished creative that converts on LinkedIn or in RFP appendices demands a production budget. Clarify up front how many videos are included annually and what incremental units cost.
Extra platforms trigger add-ons. If your contract covers Google and LinkedIn but you later want Facebook, Bing, or programmatic display, expect $1,500 to $3,000 monthly per additional platform to cover setup, creative adaptation, and ongoing management. CRM workflow automation (complex nurture sequences, lead scoring models, and integration with field service software like ServiceTitan or FieldEdge) often falls under “custom development” billed hourly at $150 to $250.
AI-driven creative revisions and testing (a hot line item in 2026) can run $500 to $2,000 monthly if the agency uses proprietary tools for dynamic ad generation or personalized landing pages. Ask whether AI fees are bundled or billed separately, and whether you get access to the underlying models or just the output. Lock in a clear change-order process: any work beyond the signed scope requires a written estimate and your approval before the agency starts billing. This prevents surprise invoices that blow your budget and sour the relationship.
Quick Calculator: Estimate Your Monthly Spend in 3 Inputs
Here’s a choose-your-path framework you can run in two minutes. Grab your annual revenue target, number of active markets, and monthly pipeline goal, then follow the logic:
Step 1: Revenue to marketing budget. Multiply your annual revenue by 8% (conservative) or 10% (aggressive growth). Divide by twelve for your monthly total.
Example: $6M revenue × 8% = $480k annual, or $40k monthly.
Step 2: Markets to management complexity. Single market: baseline fee. Two to four markets: add 25% to 40%. Five-plus or multi-division: add 50% to 75%.
Example: Three markets, add 30%. Baseline $8k becomes $10,400.
Step 3: Pipeline goal to media spend. Divide your monthly SQL target by your historical close rate to get required leads, then multiply by target cost-per-lead.
Example: Need 30 closes at 25% close rate = 120 leads. At $400/lead = $48k media. But you have $40k total budget, so either lower the SQL target or accept a higher CAC and negotiate performance pricing.
Plug your numbers in and see where you land. If the calculator spits out a number that feels impossible, you’re facing a hard choice: raise the budget, lower the pipeline expectation, or improve your close rate and LTV so the math pencils. This isn’t about precision, it’s about getting in the ballpark fast so you can have an informed conversation with agencies instead of reacting to sticker shock.
Need help making sense of the numbers or want a partner who’ll walk you through every lever and benchmark in this guide? SureShot Systems specializes in commercial HVAC marketing that’s built on transparent pricing, real attribution, and ROI you can take to the bank. Visit https://www.sureshotsystems.com to see how we structure retainers and performance deals that align with your growth goals.
Mini-FAQ: Common Pricing Questions Buyers Ask
What’s a realistic monthly retainer for a mid-sized commercial HVAC contractor in 2026?
Expect $8,000 to $12,000 per month for a growth-focused package covering PPC, LinkedIn ABM, SEO, and three to four content pieces. Single-market essentials start around $5,000, enterprise multi-division deals run $15,000 to $25,000+.
How do performance-based HVAC agency fees work?
Hybrid models pair a reduced base retainer (often 40% to 60% of traditional fees) with per-lead or per-opportunity bonuses, typically $300 to $800 per SQL in commercial markets, or 8% to 15% revenue-share on closed deals with attribution windows and clawbacks.
What ROI should I expect from an $8,000/month agency investment?
Target 3:1 to 5:1 LTV-to-CAC ratios with payback in three to eight months for service contracts. If your average deal is $80,000 at 25% margin and you close 25% of SQLs, expect CAC around $2,500 and $20,000 gross profit, netting 8:1 return over the contract life.
How much should I budget for PPC if I’m spending $10,000/month on agency fees?
Aim for a 3:1 to 5:1 media-to-fee ratio, so $30,000 to $50,000 monthly in ad spend. Lower ratios starve campaigns, higher ratios suggest you’re overpaying on management or underfunding creative and strategy.
What’s included in a $5,000/month essentials retainer?
Foundational PPC in two to three service categories, core on-page SEO, one to two blog posts or landing pages monthly, call tracking with basic attribution, and monthly reporting. Expect 15 to 30 inbound calls monthly, but no LinkedIn ABM, video production, or deep CRM automation at this tier.
Why does commercial HVAC marketing cost more than residential?
Longer sales cycles (three to eighteen months), multi-stakeholder buying committees, higher CPCs ($40 to $100+ per click), ABM data costs, compliance documentation needs, and technical content production drive B2B fees 30% to 60% higher than residential campaigns.
How long until I see steady SQL flow from a new agency?
Plan 90 to 180 days to reach steady state. PPC stabilizes in 30 to 60 days once conversion data feeds bidding algorithms, but SEO and content compound over months. If you’re not seeing target SQL volume by month four, diagnose targeting, creative, or sales process gaps.
What hidden fees should I watch for in agency contracts?
Landing page builds ($1,500 to $4,000 each), video production ($2,000 to $5,000 per piece), additional platform management ($1,500 to $3,000/month), CRM automation hourly rates ($150 to $250), and AI creative tools ($500 to $2,000/month) often live outside base retainers. Demand a clear change-order process and written estimates before any extra work starts.
About the Author
Ben Desjardins is the founder of Sure Shot Systems, a digital marketing agency that strips away the opacity plaguing agency pricing and delivers enterprise-grade strategy to commercial HVAC contractors at transparent, performance-aligned rates. As a three-time founder and published author with over 20 years in digital marketing, Ben has negotiated, audited, and optimized hundreds of agency agreements, giving him an insider's view of which pricing models actually align incentives and which ones just protect agency margins at client expense.
Sure Shot Systems was built to solve the exact frustrations outlined in this pricing guide: retainers that bloat without accountability, performance deals with rigged definitions, and scope creep that doubles invoices while lead quality tanks. Ben's approach rejects the industry playbook of long-term lock-ins and vague deliverables. Instead, Sure Shot operates month-to-month with full pricing transparency, tracking infrastructure that proves CAC and LTV by channel, and SLAs tied to outcomes that matter: qualified SQLs, close rates, and pipeline revenue, not clicks and impressions.
His client base spans commercial HVAC contractors chasing plan-spec bids, design-build opportunities, and service contract growth across multiple markets. They choose Sure Shot Systems because Ben's team functions as an extension of their leadership, delivering strategic depth, creative execution, and attribution rigor without the overhead of enterprise agency bureaucracy. Most clients see positive ROI within 30 days and acquisition costs that undercut lead aggregators by 80%+, backed by transparent reporting that connects every marketing dollar to booked revenue. Ben's pricing analyses and ROI frameworks have helped commercial contractors across the trades negotiate smarter deals and fire agencies that can't prove their value. Follow Ben on LinkedIn.


Got a question?
Send us a message. We're happy to help.
